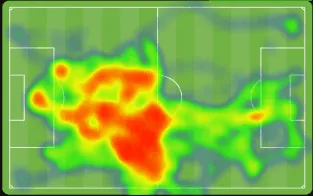
How heatmaps are generated
GPS devices — whether a dedicated pod or a smartwatch in a tracking vest — record your position multiple times per second. That is thousands of location data points over 90 minutes.
After the match, the software overlays all those points onto a scaled pitch diagram and runs a density algorithm. Zones where your data points are tightly clustered get mapped as “hot.” Zones where you barely registered a position show up cool or empty.
The result is a visual summary of your positional footprint across the entire match — not just a snapshot, but the accumulation of every step you took, every run you made, every recovery you tracked back.
Consumer GPS systems (including Scorza) typically sample at 1 Hz or faster, which is enough resolution to accurately map positional patterns across a 90-minute match. Professional broadcast heatmaps use optical tracking systems that can hit 25 frames per second, which is why you will sometimes see more granular detail on TV — but for understanding your positional profile, 1 Hz GPS is more than sufficient.
What the colours mean
Heatmap colour scales vary slightly by system, but the logic is consistent:
- Deep blue or purple (cool): zones you rarely entered. You were barely here.
- Green or yellow (mid): zones you passed through but did not spend meaningful time in.
- Orange (warm): zones you returned to regularly. This is active territory.
- Red or white (hot): your most-frequented zones. Your “home” on the pitch during that match.
The hottest point on your heatmap is your average position — the zone that best represents where you were most often when averaged across the full 90 minutes. Defenders will see their hottest point in their own half. Strikers should see theirs in the attacking third. Midfielders — depending on their role — will sit somewhere in the middle.
What a good heatmap looks like by position
Centre-back
Deep and central. The hot zone should sit in the defensive third, roughly between the two centre-backs’ channels. The area from your own penalty box to about 20 metres past the halfway line should show activity from defensive pressing and stepping out. Anything approaching the opposition penalty area is unusual — and might indicate you are leaving your position too often.
Defensive midfielder
Central, sitting just ahead of the defensive line. The hot zone should occupy the space roughly between the two penalty areas, biased toward your own half. A good DM heatmap looks like a central rectangle that acts as a protective screen in front of the back four.
Box-to-box midfielder
The longest heatmap on the pitch. A central column running from just outside your own penalty area to just outside the opposition’s. The heat should be spread relatively evenly up and down that central corridor — evidence of covering the full length of the pitch in both directions.
Winger
Wide and advanced. The hot zone should sit in the wide channel on your side of the pitch, biased toward the attacking half. A winger’s heatmap that shows significant heat in the defensive third usually means too much tracking back, or a team defending deep for long periods.
Striker
Advanced and central. The hot zone should sit around or ahead of the opposition’s defensive line — occupying the space the striker is pressing, holding or running in behind. A striker whose heatmap shows heavy presence in their own half suggests they are either pressing very aggressively or the team spent a lot of time without the ball.
Common patterns and what they reveal
Narrow heatmap, concentrated in one zone
You stayed in role and held your position well. Useful for defenders and central midfielders. Could indicate limited involvement for attacking players.
Wide, scattered heatmap
You followed the ball wherever it went. Could indicate good pressing instincts, or it could flag that you are not maintaining positional discipline. Context matters.
Thin strip along one flank
You were running channels and staying wide. Classic winger or full-back pattern. If you are a central midfielder with this heatmap, that is worth examining.
Heavy concentration in your own half
Your team spent a lot of time defending, or you were tracking back significantly more than your position typically requires. Could be tactical or could flag drift out of position.
“Your heatmap either confirms what you thought you did — or tells you something your memory got wrong.”
Why pros and amateurs both benefit from heatmap data
Elite clubs use heatmaps to monitor tactical shape, check that players are occupying the right zones in different phases of play, and analyse the opposition’s positional patterns before matches. Analysts in the top flight review heatmaps after every game.
Amateurs benefit for a different reason. You do not have a coach watching every run. You do not have a camera recording your movement. Your honest sense of “where you played” is built from a handful of memorable moments — the tackle you made, the pass you hit, the sprint you made in the second half. That is not the full picture.
Heatmap data fills in everything between those moments. It confirms whether your sense of your positional game matches what actually happened. Often it does. Sometimes it does not. Both outcomes are useful.
How to get your own heatmap from any Sunday match
You need a GPS tracker running during the match and an app that processes the data into a heatmap overlay. There are two realistic routes:
Dedicated GPS pod (StatSports, Catapult, etc.) — a separate device you charge, clip into a vest and retrieve after the game. Generates heatmap data through its own app.
Scorza — if you already own an Apple Watch, Garmin or Wear OS watch, you do not need a second device. The Scorza vest holds your watch in a padded pocket on your back, under your match shirt. The Scorza app reads your GPS data and generates a heatmap, sprint map, distance and heart rate zones from your match — plus a full match log entry with team names, shirt colours, score and venue, so each heatmap is tied to the game it came from. After the game, the data syncs back into Apple Health or Garmin Connect.
The heatmap is available in the app as soon as your match data has processed — typically within a few minutes of finishing the game. You can compare heatmaps across different matches to track whether your positional patterns are consistent or shifting over time.